Service Type
E-Scooter App
Project Status
Launched
Role
UX Manager | 60% (3 UX Team members)
Tool
Figma, Powerpoint, Illustrator


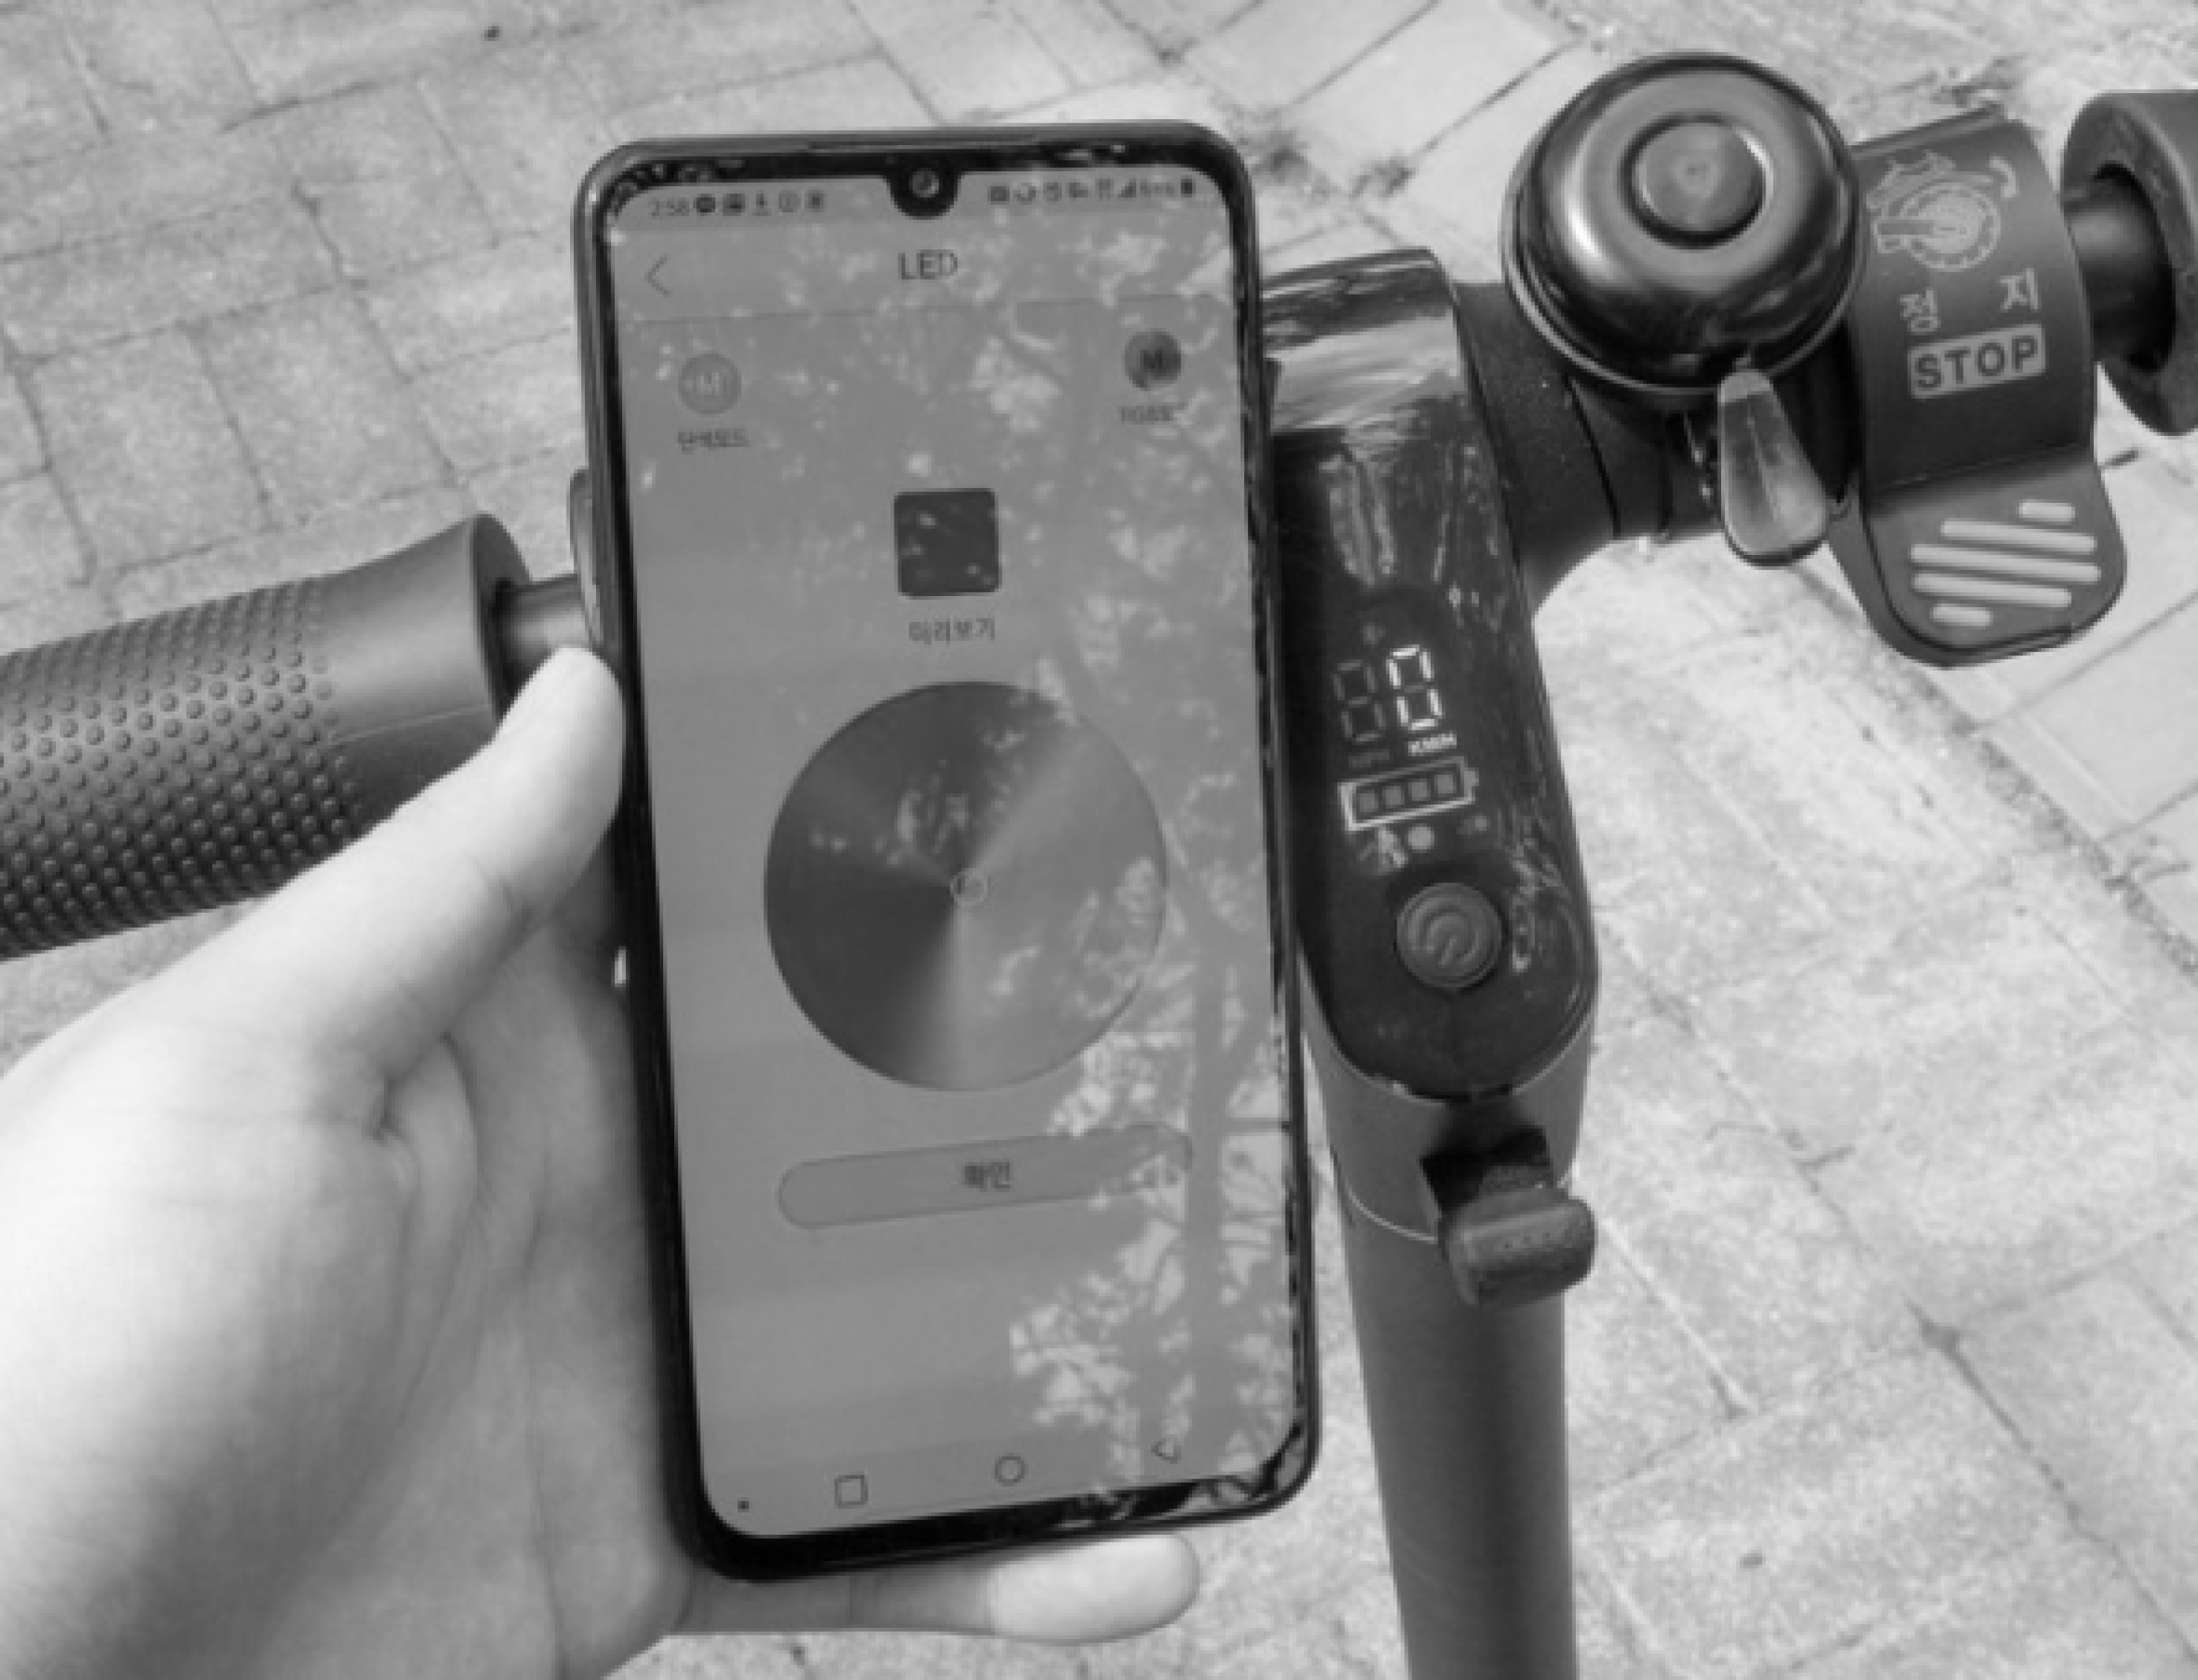
iNavi Road Gear XT
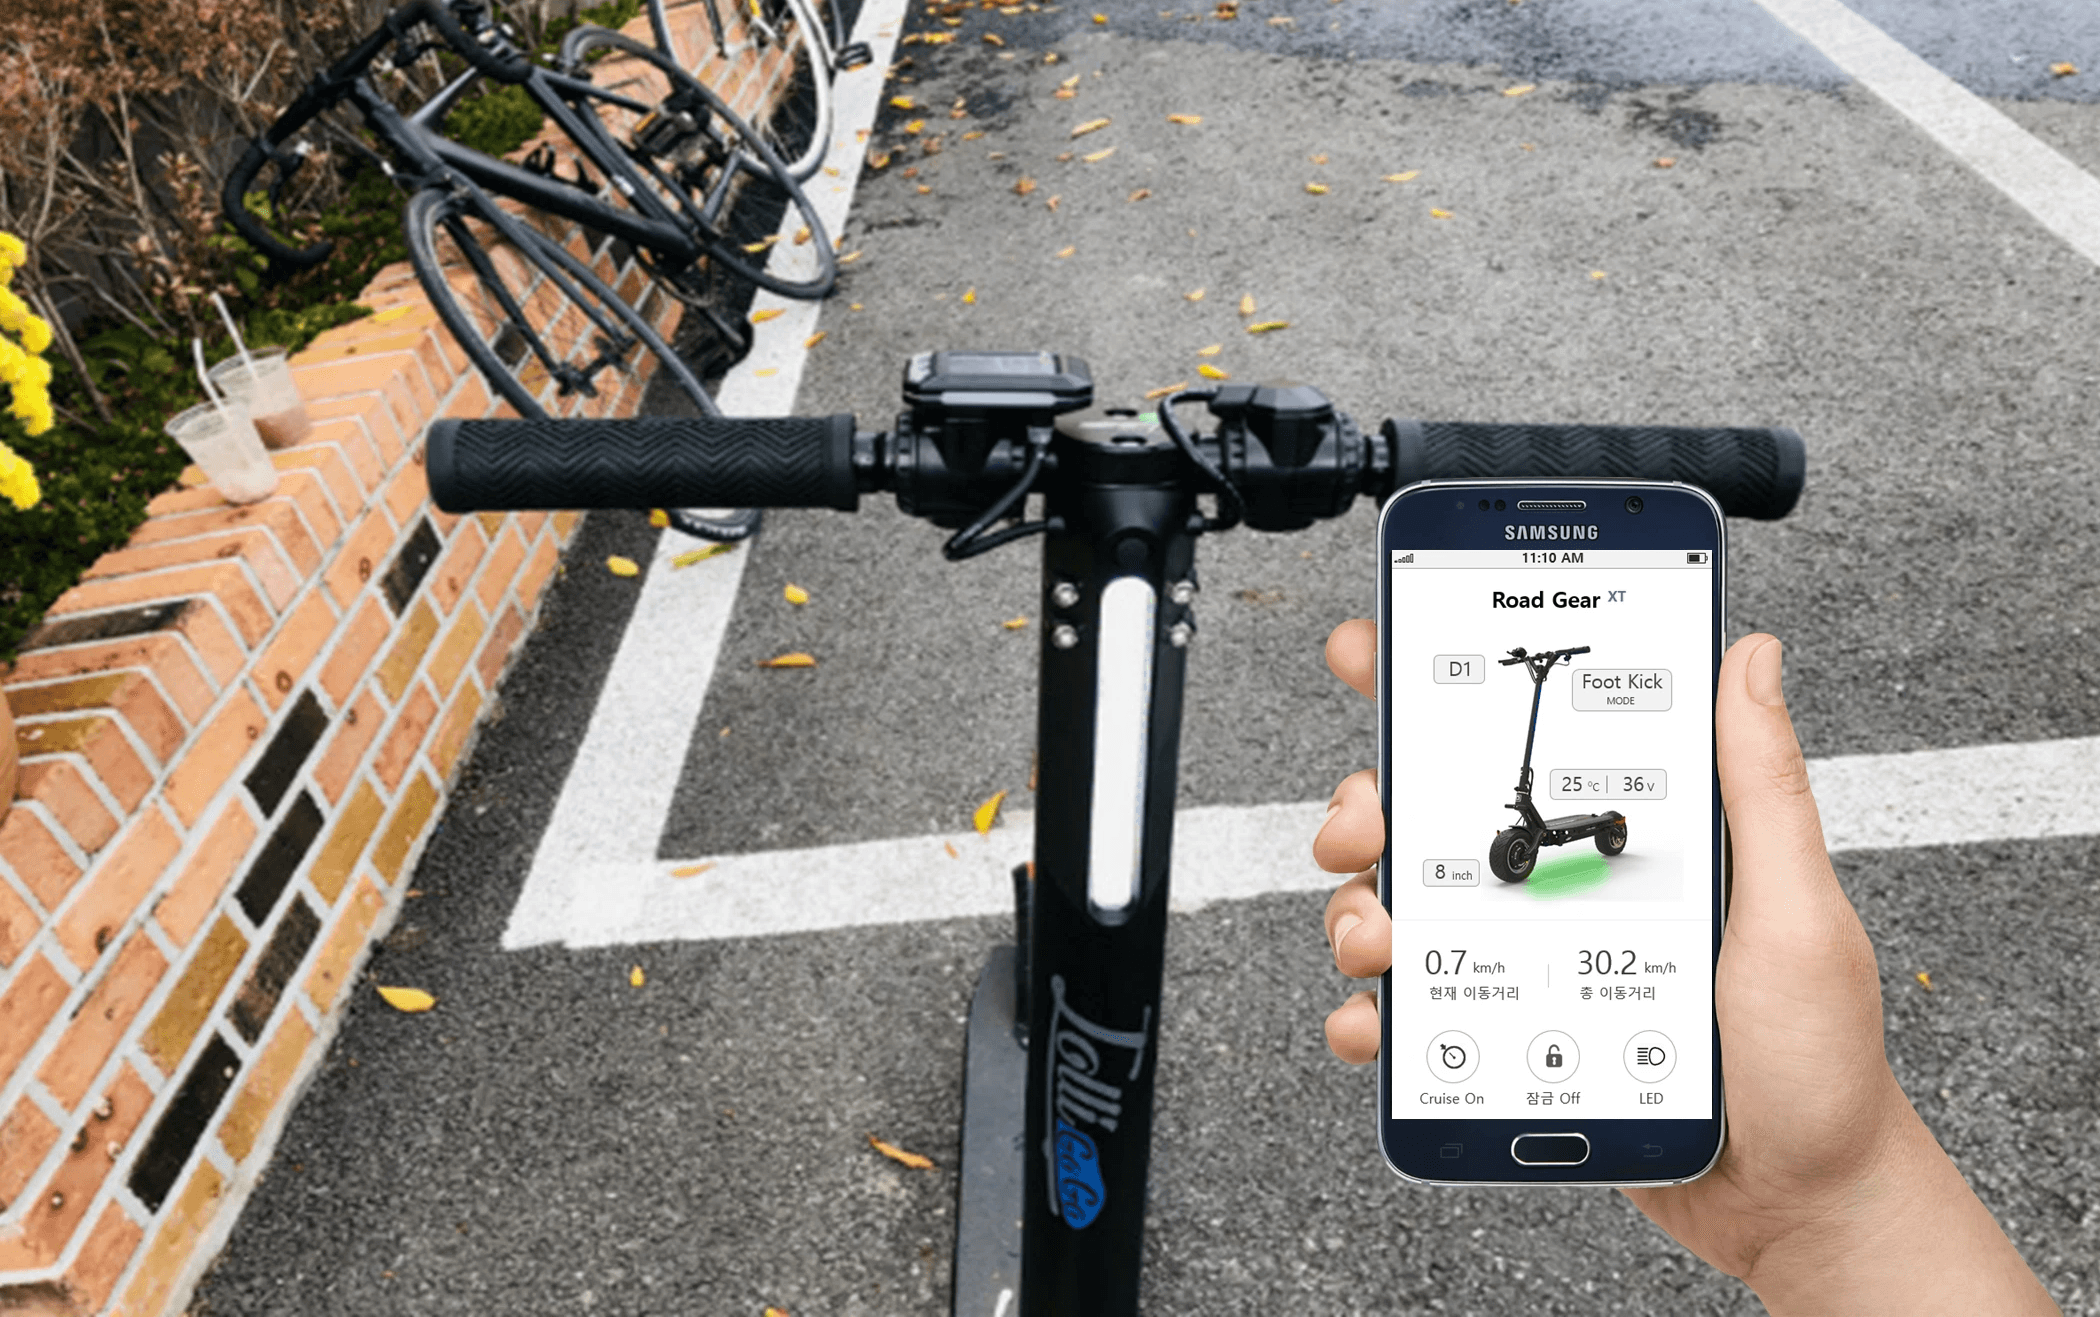
Ultra-light Urban Personal Mobility with Integrated Electric Scooter App
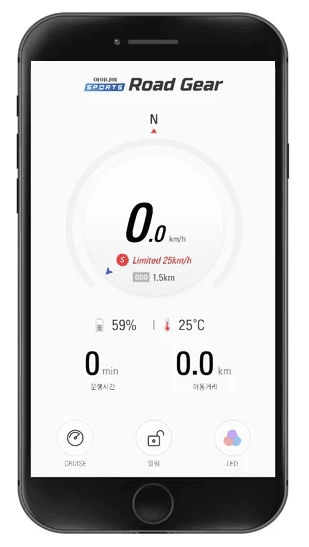
iNavi Sports XT is a lightweight urban electric scooter that, through its connection with an app, provides real-time riding information.
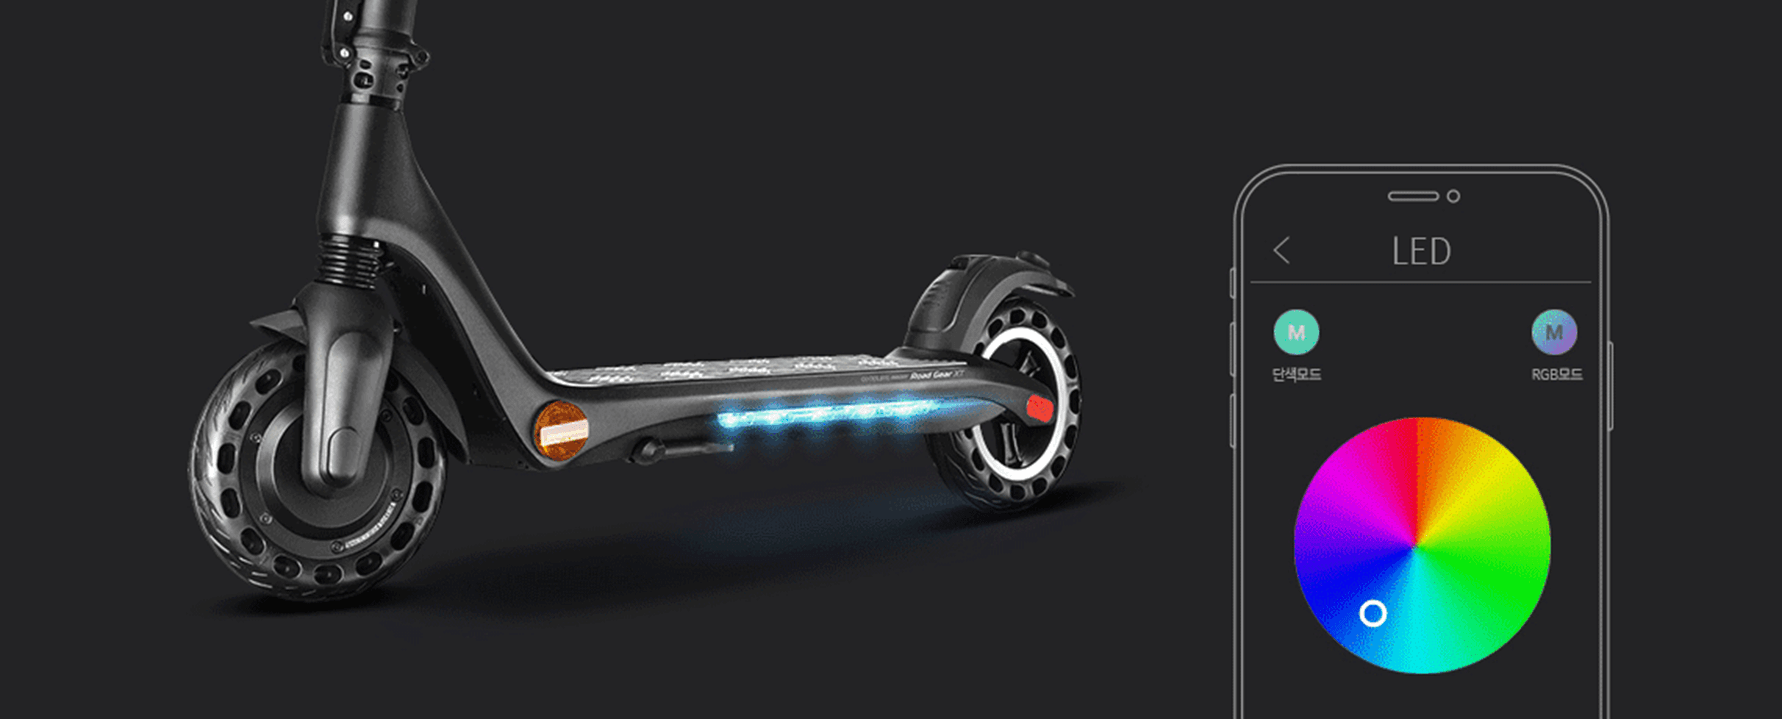
It supports various features such as changing the LED color of the electric scooter, cruise mode, lock settings, and compass display.


Work Process
Deliver
Detail Design
Implementation
Analysis
User Research
> Questionnaire
> In-Depth Interview
Building Concept
A/B Test
> App Main Screen
> Instrument Panel Information
Layout and Control Convenience
Competitive Analysis
Requirements
Wireframe
Key Screen Design
Usability Testing
App Launch
User Needs
UX Concept
Competitive Analysis & Positioning Map
We conducted competitor analysis in the market to analyze the characteristics and competitive advantages of each product.
Based on this, we determined the direction for the service position that the iNavi XT app should aim for.
Diverse age groups
App Name
Platform
Rating/
Number of Reviews
Main Features
Communication
Method
Competitive Edge
Segway-Ninebot
Android
iOS
Efficient arrangement of essential information with simplicity
User-based SNS-driven driving record sharing and ranking service
Expanding beyond simple driving information to a user content-centric SNS service


Android
iOS
Providing a versatile integration environment for various product lines, ensuring easy access when linking multiple product categories
Scooter Metaphor for Intuitive Info
Interoperable with various product lines from Xiaom
Xiaomi_MIJIA

Android
iOS
Providing a local SNS for users to share scooter-related information.
Supplying energy consumption information comparable to automobiles
Graphs for Speed and Energy Consumption Info
User-based SNS-driven driving record sharing and ranking service
INMOTION SCV

Android
iOS
Providing necessary information and features in a simple
and clear manner
Delivering clear information during travel with minimum data
Adult and Child modes are categorized
GYROOR

Core features
Diverse features
Focused on
the 20-30 age group
Service Positioning

What is the position of the iNavi RoadGear electric scooter?
Providing essential information and user environments tailored
to capture the 20-30 age group
Providing essential information and key features crucial for driving
Targeting a blue ocean strategy for a position not yet explored
by competitors.
User Needs
To identify essential features for a scooter app, we conducted a survey, uncovering key insights based on the collected data.
Survey participants
Scooter owners:
20 individuals
Scooter prospective buyers:
20 individuals

Surveying users to understand the needs


Current speed
1.
Battery information
2.
3.
Bluetooth connection status with the phone
Operating time
4.
5.
My location and route on the map
6.
Total mileage
7.
LED On/Off status
8.
Others
What is the most important information when using a scooter app?
Survey results of 20 scooter owners
Please list in order of importance the information you consider important.
킥보드 보유 고객 20명 조사 결과
Please list in order of importance the features or information you consider crucial.
Survey results of 20 prospective scooter buyers
Speed/
Direction information
/Current location
Battery information
Fast and stable
connection with
the phone
Theft prevention alert
LED configuration
for night-time rides
If you use a scooter app, what is the most essential feature
or information you need?
UX Strategy
Based on user surveys, we formulated key UX strategies, prioritizing the provision of essential scooter information at a glance and ensuring quick access to all features.
Additionally, we decided to enhance user engagement by incorporating entertaining elements and introducing customized features based on user preferences.


03
Providing an element of fun
Customizable real-time LED colors on the scooter based on user preferences (Motion LED mode / Single-color mode)

02
Providing quick access by organizing
all settings and information with a depth
of 2 or fewer levels
For convenient control during driving, providing a straightforward yet shallow-depth structure

01
Providing key driving information
and status at a glance
Providing essential information and features for on-the-go, such as speed, battery status, and remaining driving distance
Use Flow
We designed a simple and user-friendly flow for the scooter app, while also developing the main control and usage scenarios for the scooter dashboard, focusing on essential features.
Low speed
(1st level: 15km/h)
※ Electric scooters and other personal mobility devices
have a legal maximum speed of 25 km/h
Short
Press
Long
Press
Consecutive
2 timesShort Press
Short
Press
Medium speed
(2nd level: 20km/h)
High speed
(3nd level: 25km/h)
Power On
Power Off
LED Off
LED On
Dashboard Control
Scooter control via the main button


Overall app use flow
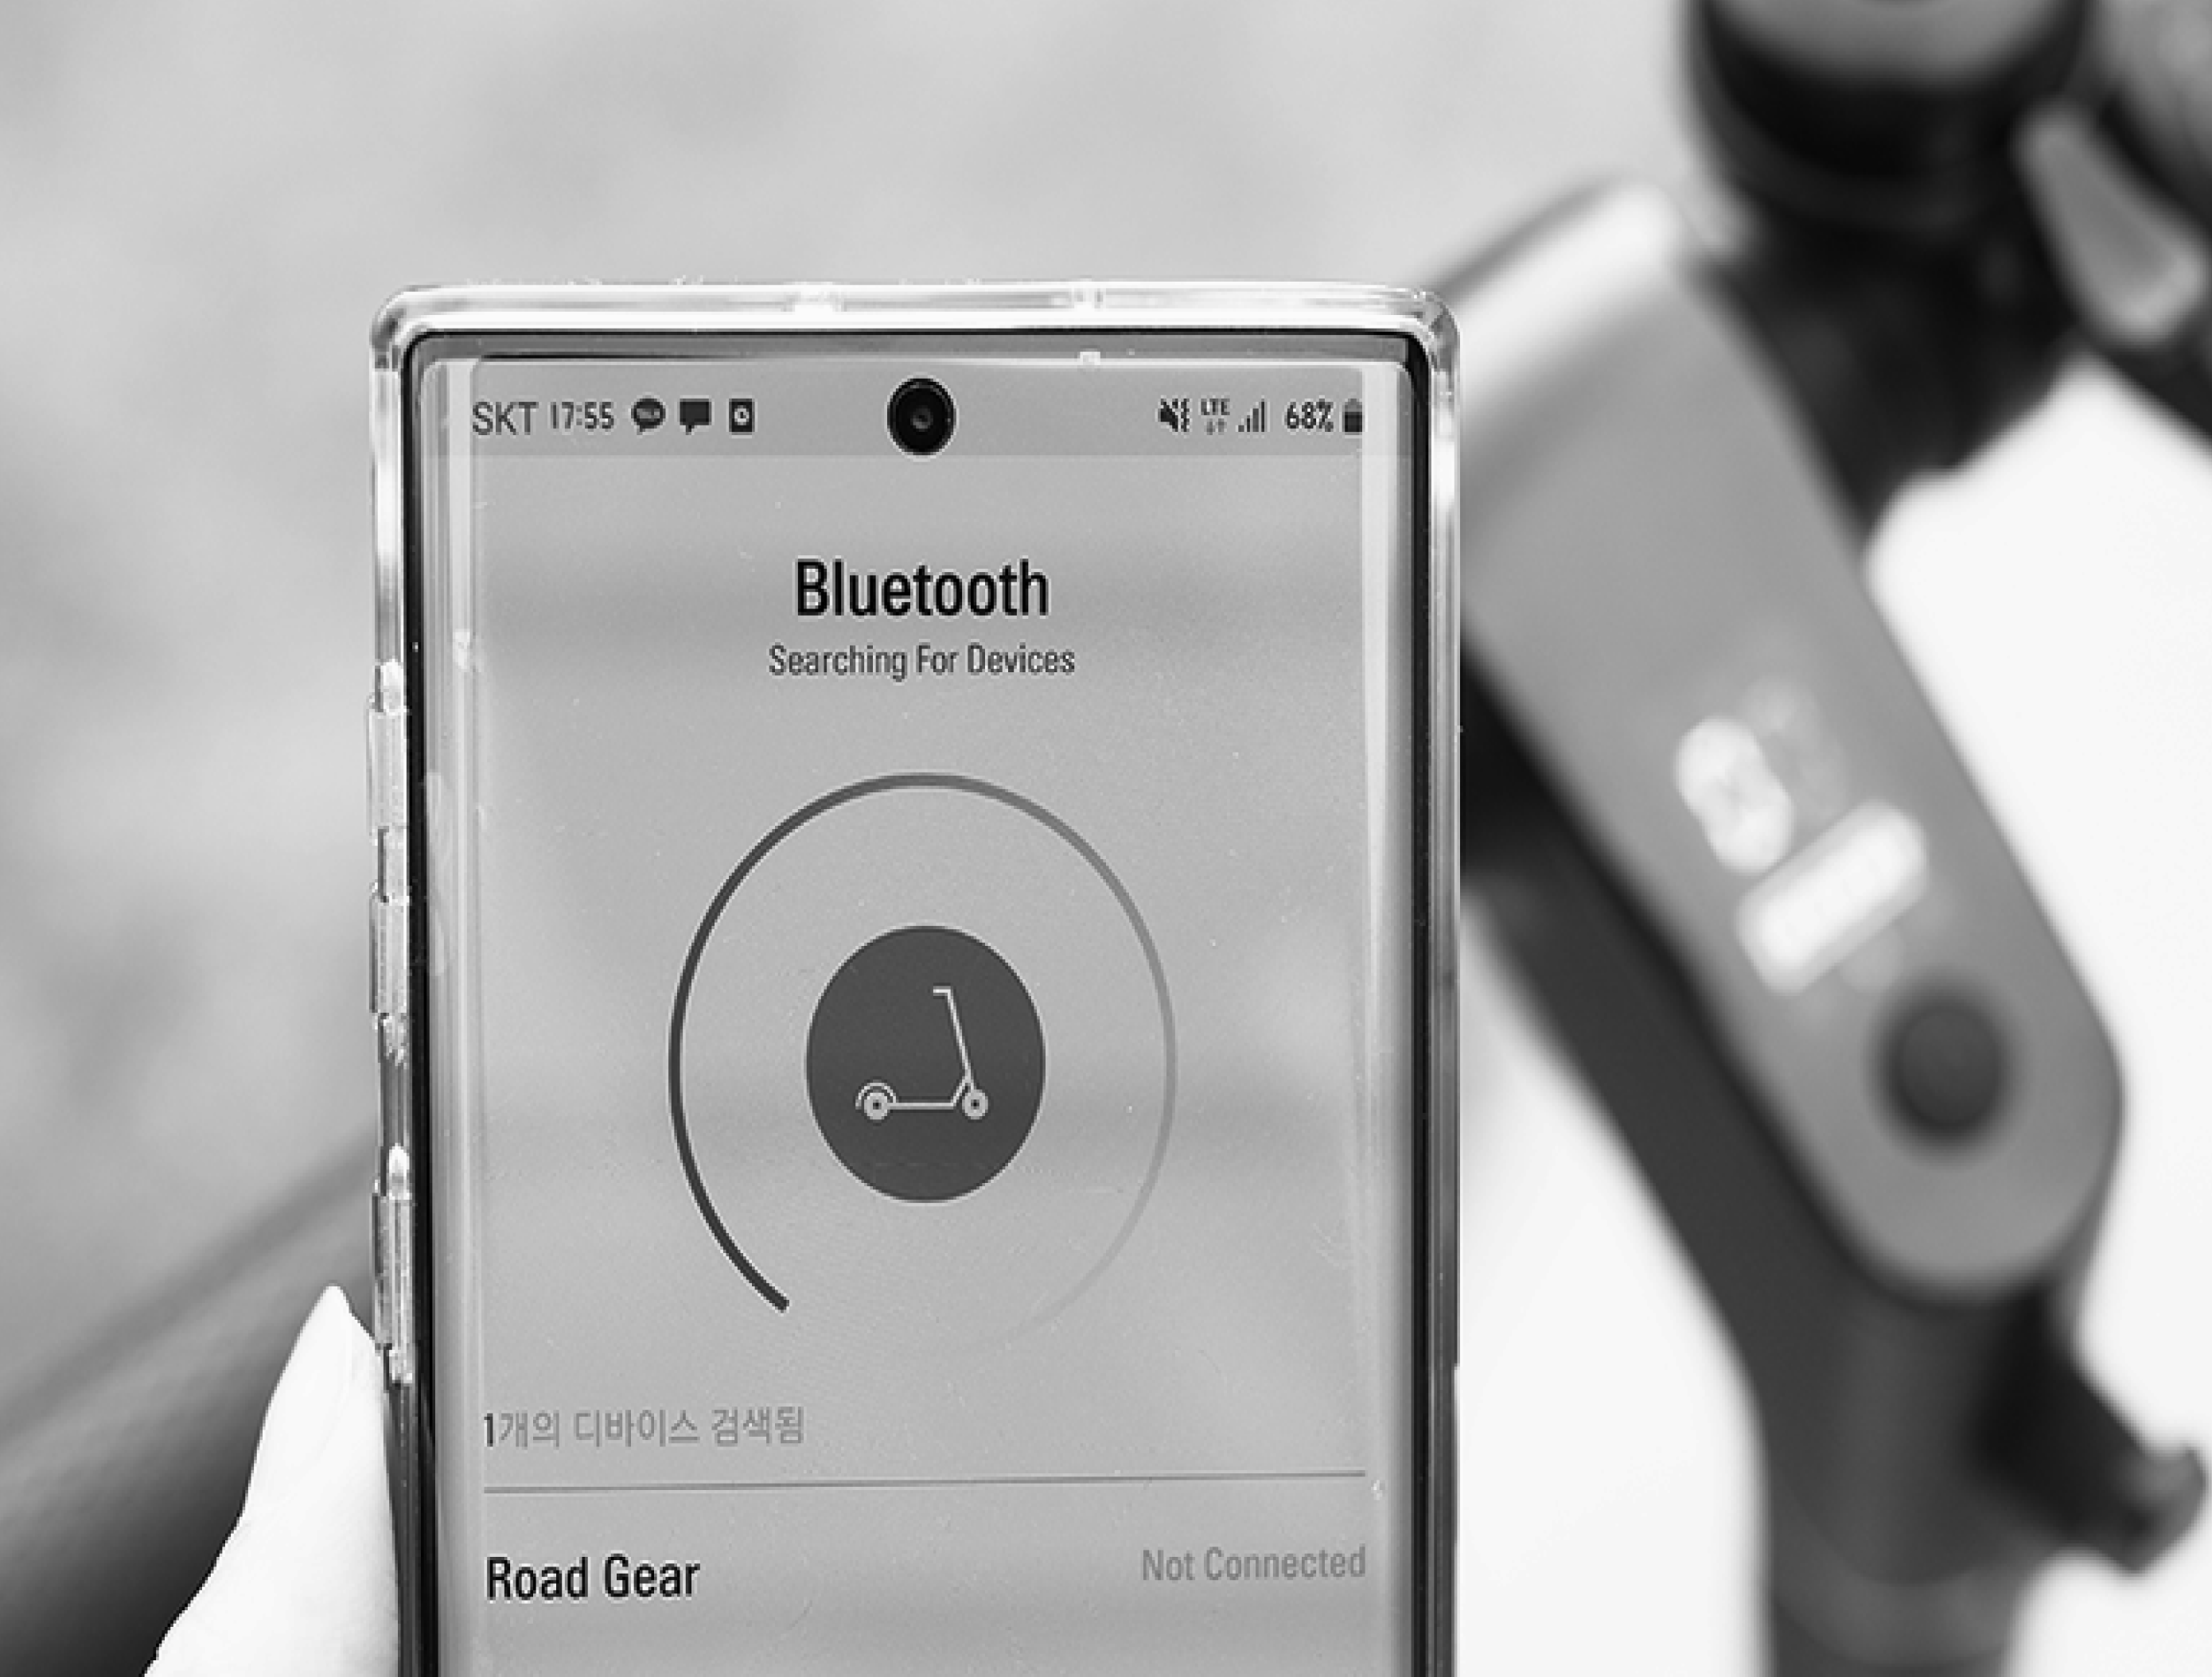
App launch
Splash
Bluetooth
connection
screen
Main Screen
LED
control
settings
Cruise
control
settings
Lock
setting

ICON
Feature name

Scooter connected to the app
Current speed
Battery level indication
Headlights On
Speed levels (1st > 2nd > 3rd)
Error and malfunction detected
Power ON/OFF


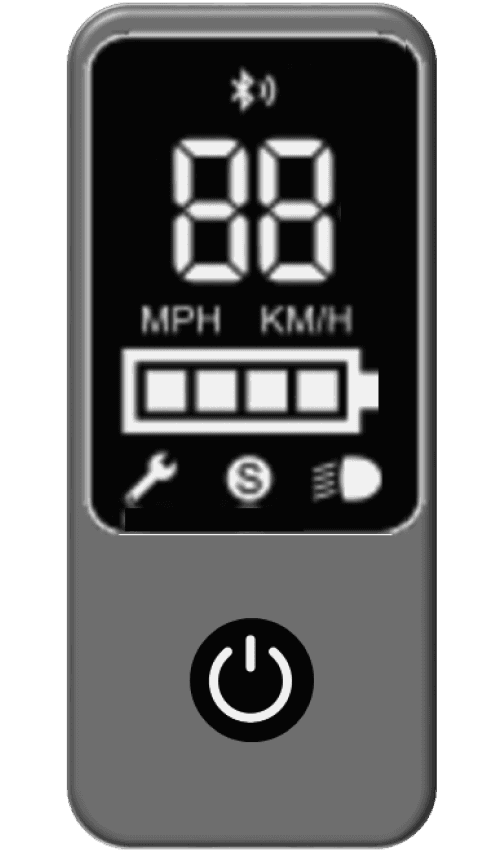
Dashboard UI
Instrument cluster information layout design
Sketch & Wireframe
We have planned a proposal document for internal discussion regarding three different UX concepts.


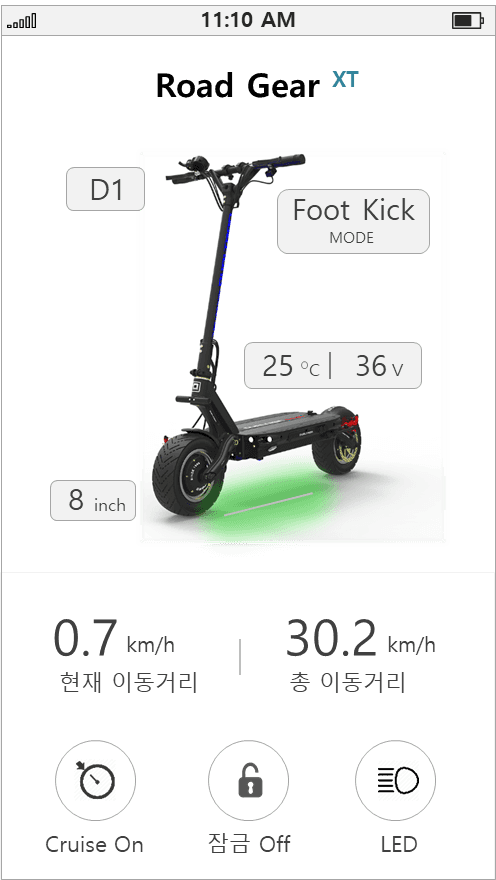
Scooter's metaphorical representation
for intuitive information
Distance Traveled
Unlocked
Total Distance
Traveled
Providing two main home screens
Main screen providing essential information
Sub-main screen offering supplementary information and controls
UX concept for key screens (Proposal A)
Distance Traveled
Unlock
Total Distance
Traveled

Distance Traveled
Locked
Total Distance Traveled


When the scooter is locked, it does not operate;
unlocking enables functionality
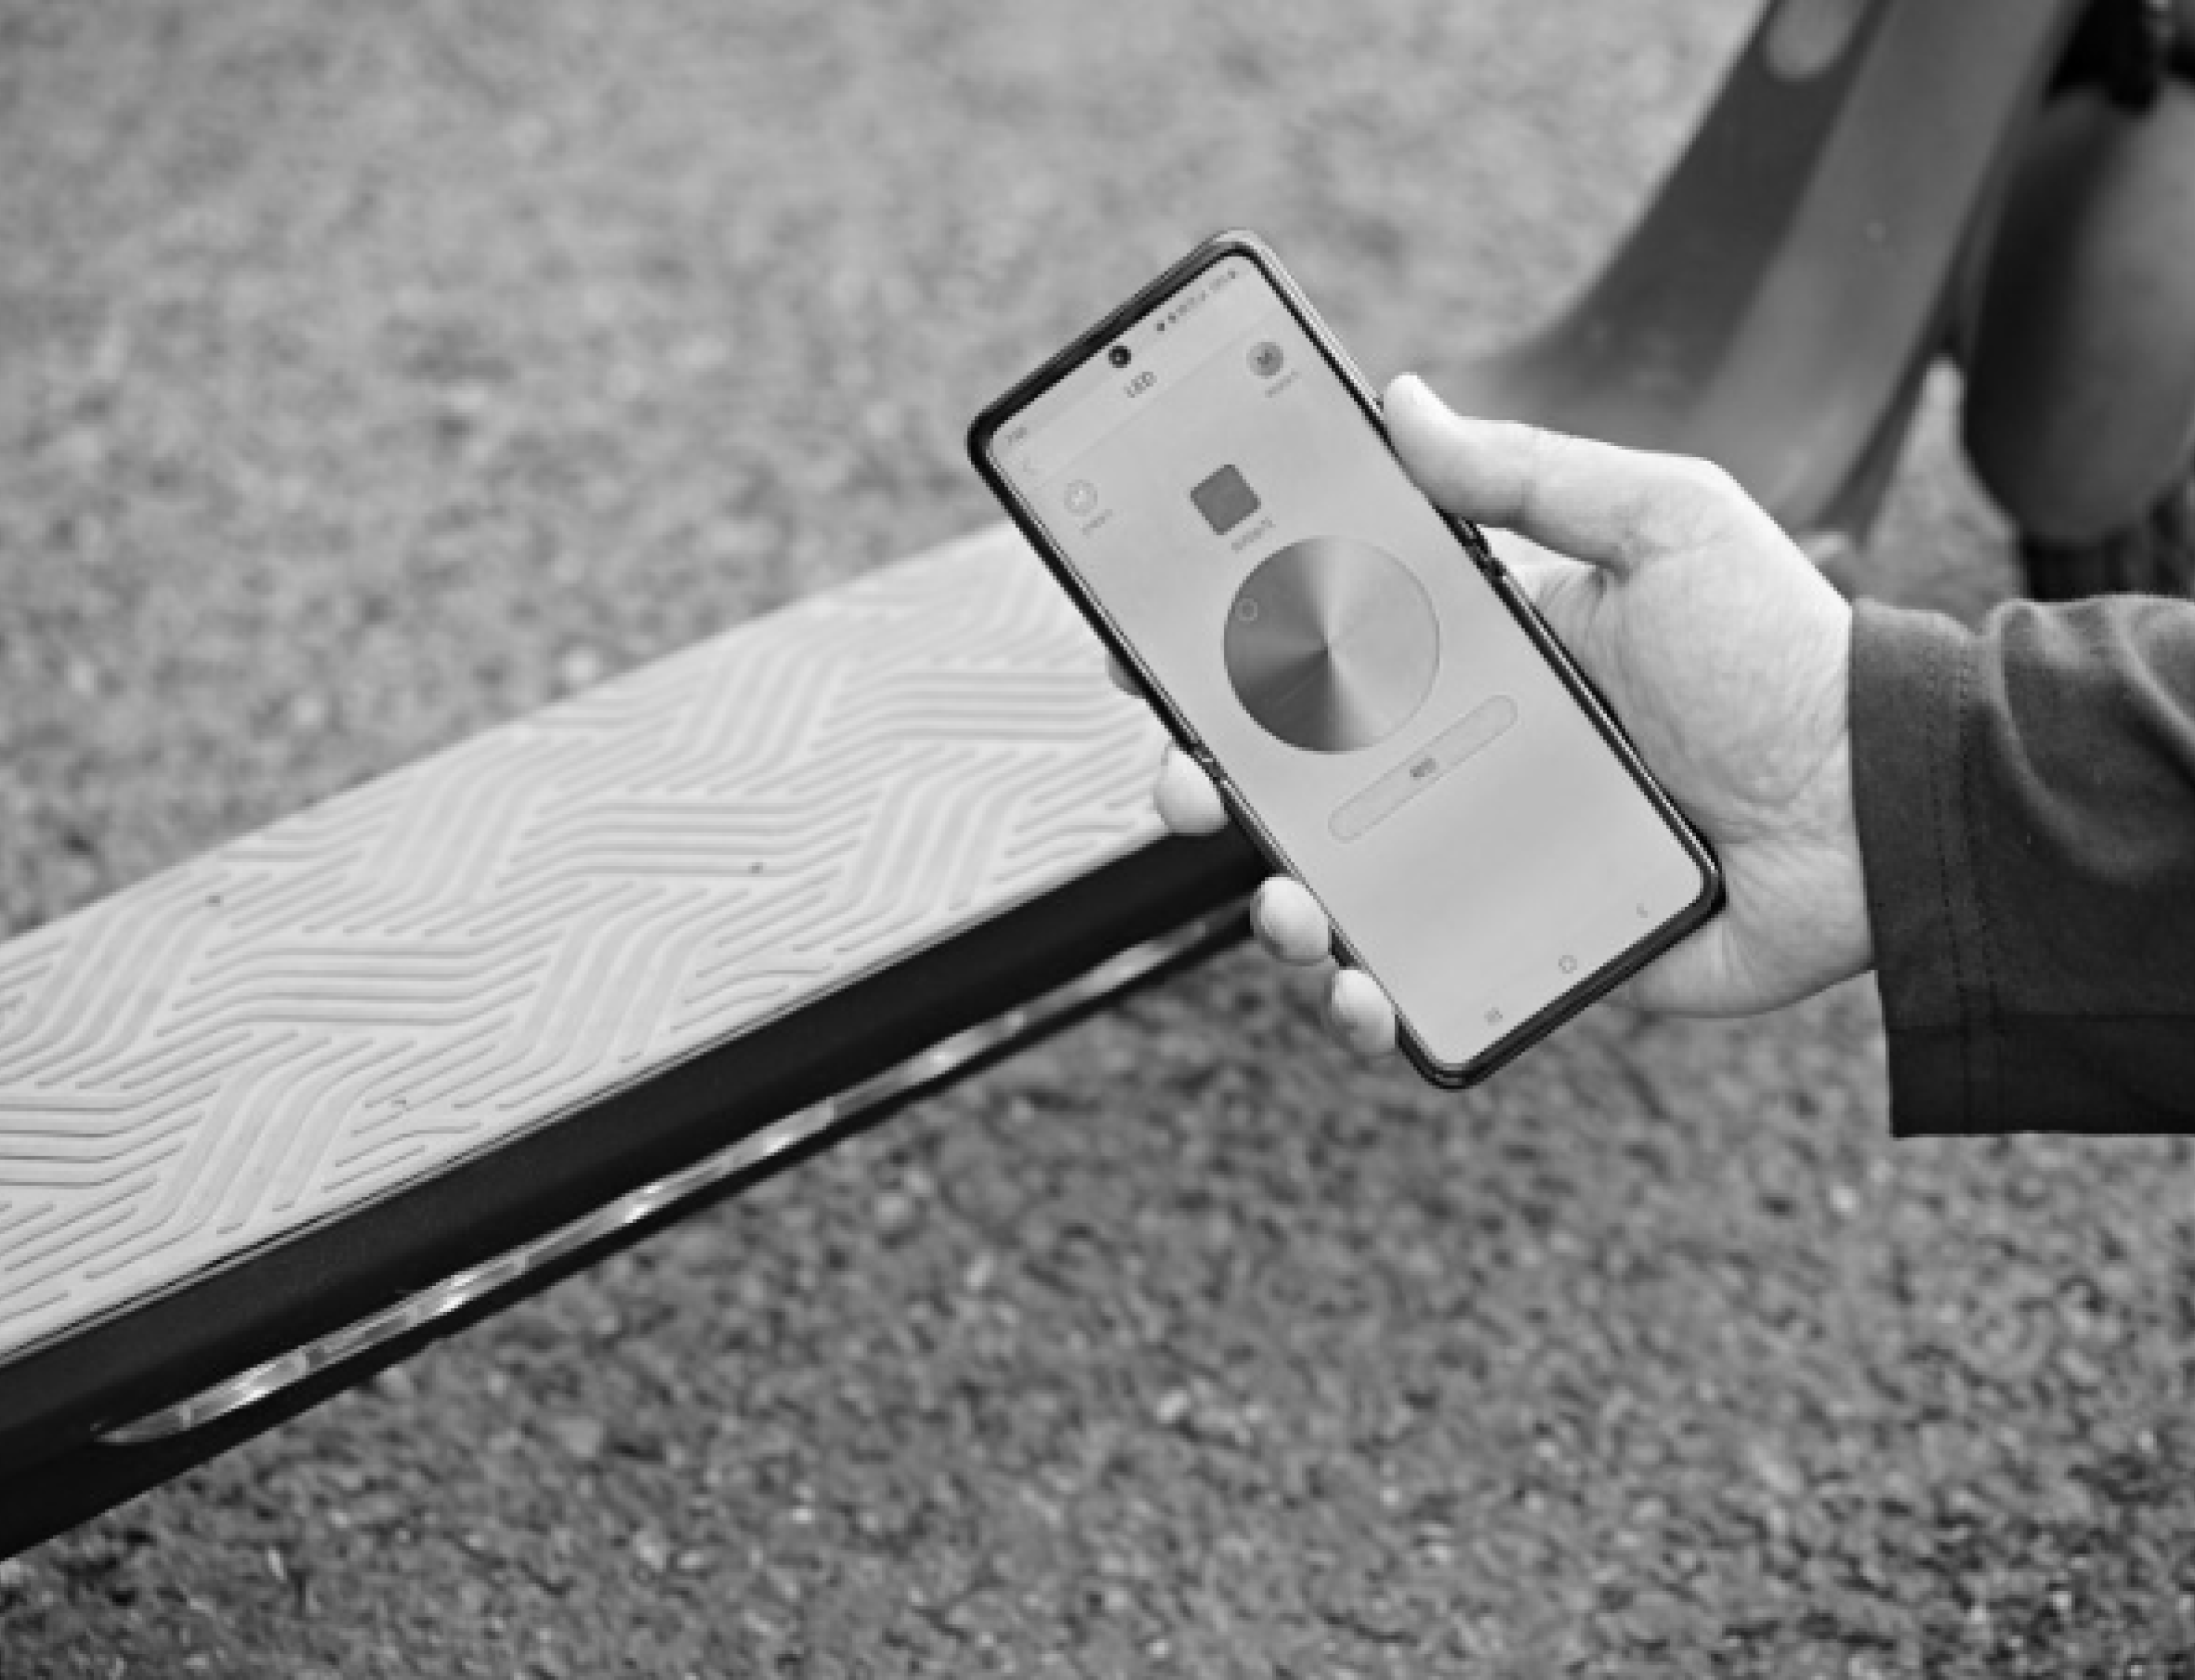
After selecting the LED color from the color palette,
tap OK
The color is adjusted, and the adjusted LED color is instantly applied to the scooter.
LED color adjustment
Scooter LED color adjustment through a color palette
Lock
Preventing other people's control by preventing
operation through the Lock button.
UX concept for key screens (Proposal A)
Swipe

LED Button
Color
Change

Color
Change
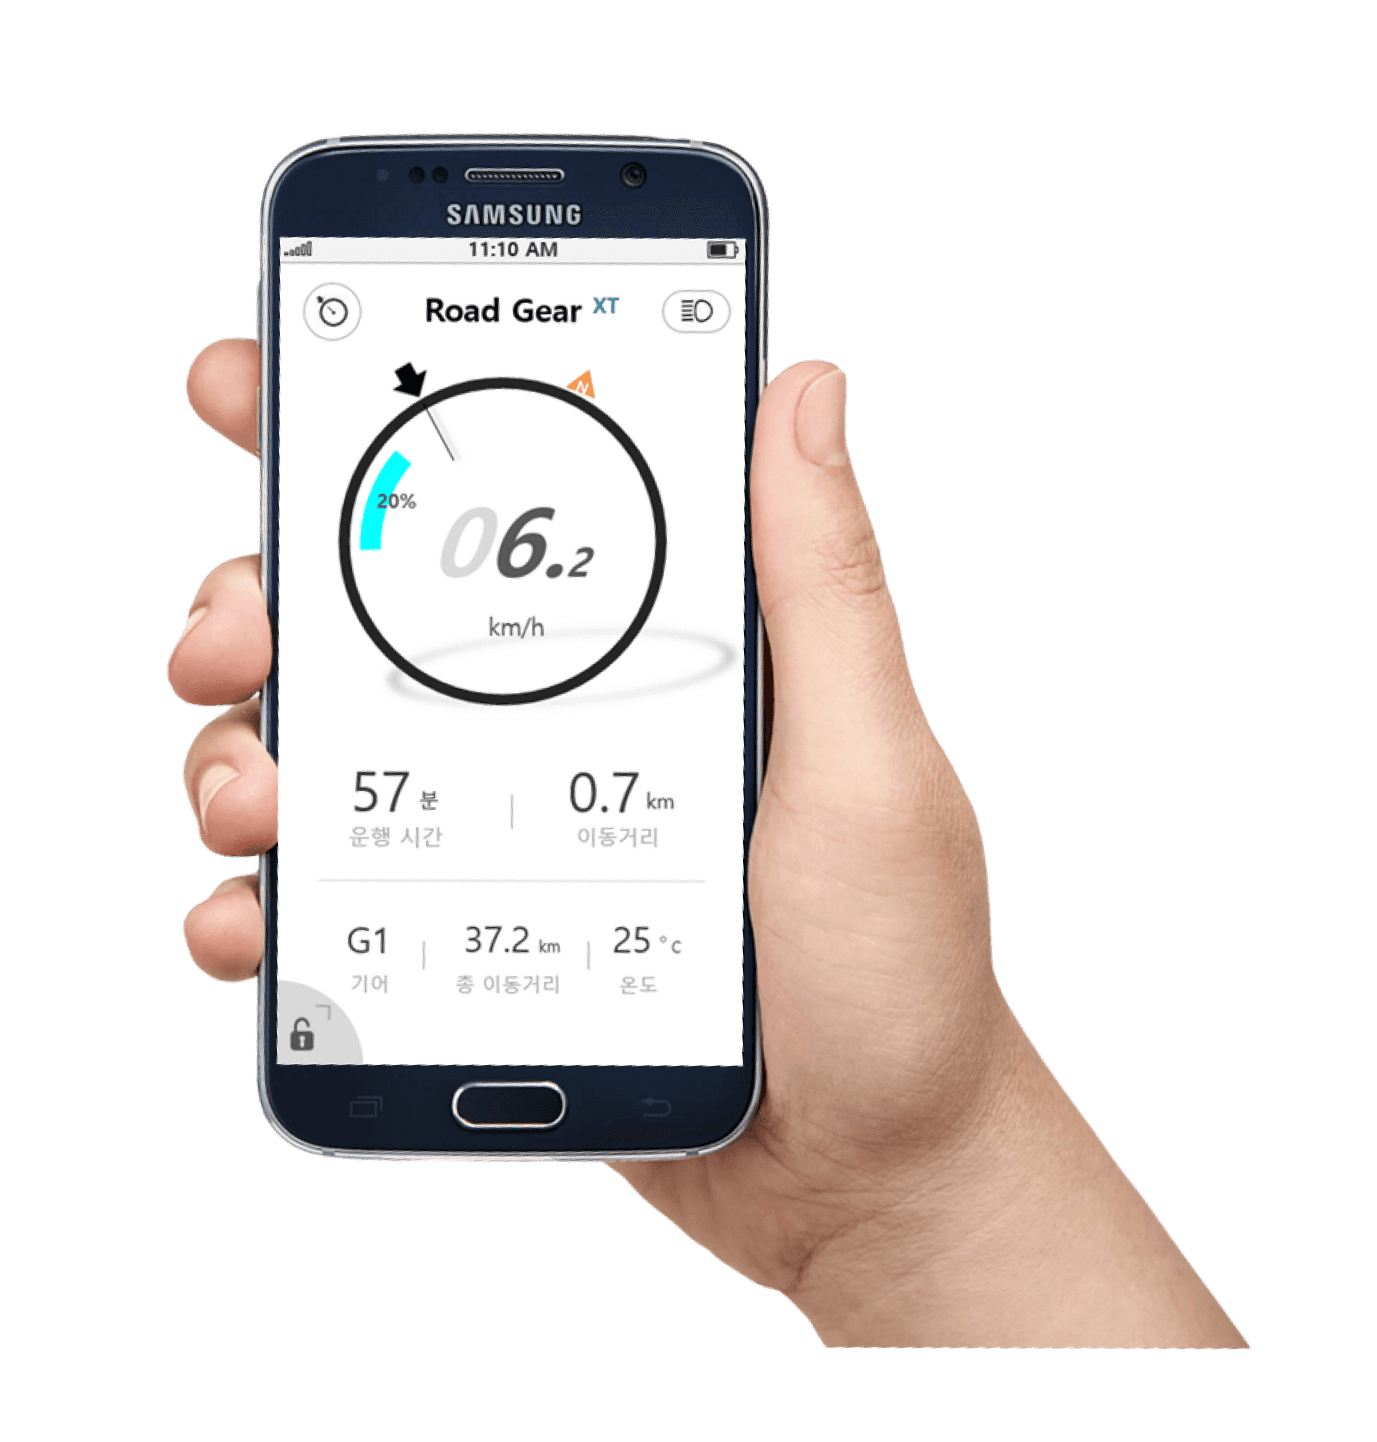
A bar graph flows horizontally to the left,
presenting changes in speed through
variations in height differences

240 Samsung Road, Seoul.
Moving at a speed of 0.7 km/h
for 57 minutes.


Enhancement of map information
The primary concept is to elevate the main screen to a vehicle navigation level,
focusing on driving guidance, including providing the current location
within the map and enhancing overall map information
UX concept for key screens (Proposal B)
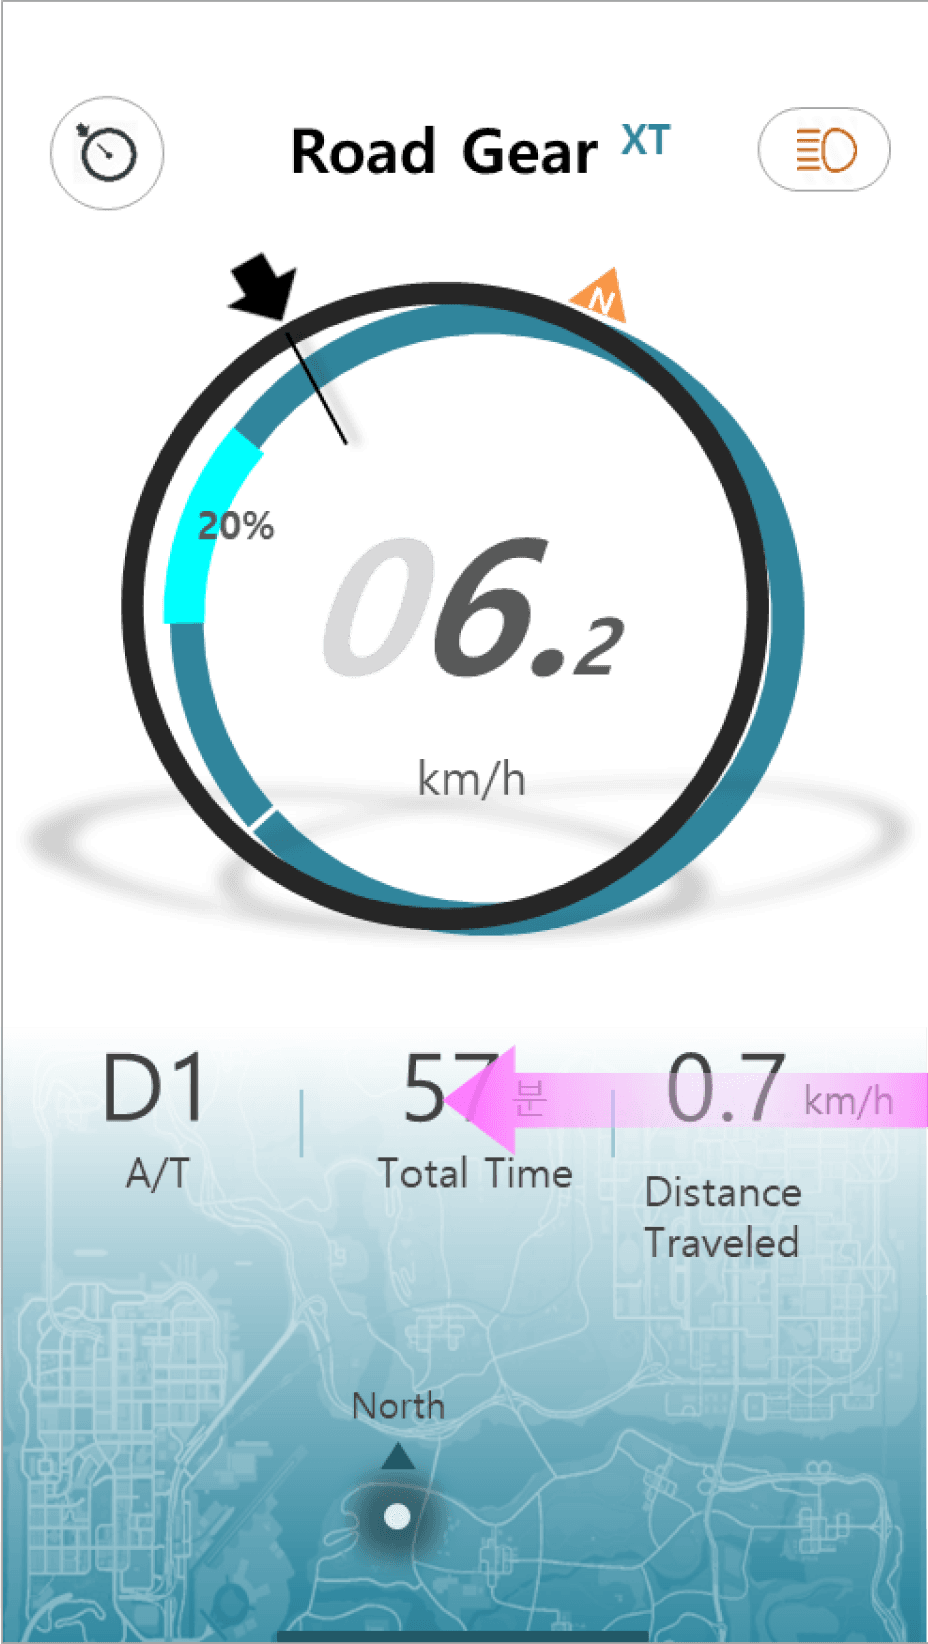

Displaying the current location on the actual map
Simplification of map information
Simplify the display of the route to enhance intuitive and aesthetic elements.
UX concept for key screens (Proposal C)
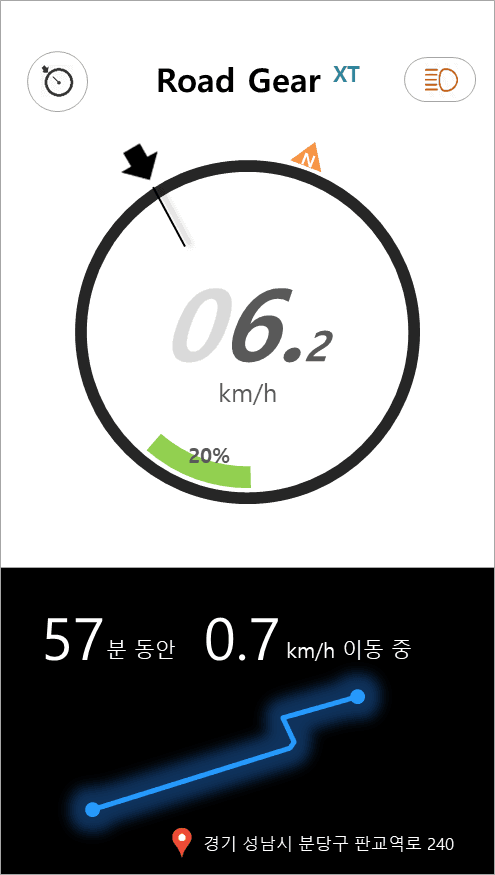
240 Samsung Road,
Seoul
Moving at a speed of 0.7 km/h
for 57 minutes.
Simplified presentation of the route

Usability evaluation
We conducted a usability evaluation based on the initial development version, ver 1.0 of the app, focusing on usability,
Bluetooth connection stability, actual speedometer display delay, and other aspects. The evaluation was performed on real roads, considering task scenarios at different stages of driving.
Conducting Identical Tests During Day and Night

Task Scenario
The entire scenario is designed to encompass the user's journey from boarding, riding, stopping, to disembarking on an electric scooter.
We conducted the test specifically for the following key tasks:
Task
Welcome Sound (AUI)
Connecting the Scooter
via Bluetooth
Understanding the Dashboard
Display Information
Checking the connection status.
The size, position, and visibility of
key display information
BT Connection speed
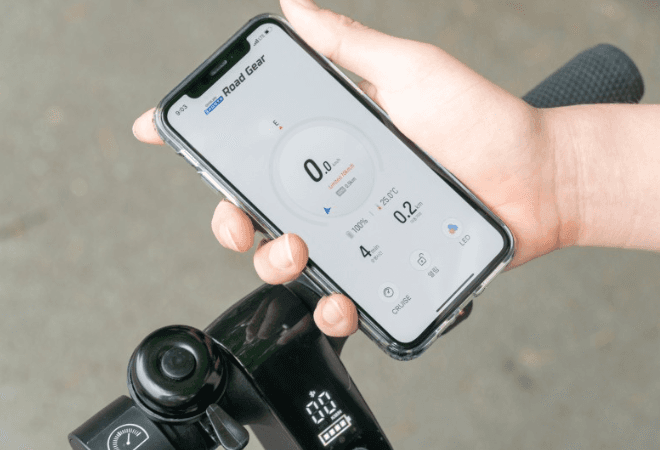
Mounting a phone
on a scooter
Changing LED colors
Cruise control settings
Understanding driving Information
on the app's main screen
Understanding driving Information
on the dashboard
Sound notification when adjusting
speed limit settings (AUI).
Setting up
lock mode
Driving Distance,
Checking
Cumulative Mileage
Evaluation Form
Opinions on Each Task
and Overall User Experience
Overall Feedback
In-depth
Interview
Boarding
Bluetooth
Connection
Scooter
Power On
Briefing
Driving
Driving
Stopping
Getting off


Task Execution and Observation
Final Interview
2. Conducting Usability Evaluation
Observation of Participant Task Execution and Usage Patterns
Participants in the Evaluation
Five Prospective Scooter Buyers

Five Scooter Owners

Feedback on Each Task and Overall User Experience
Additional Improvement Suggestions
Additional Ideas

Results Analysis and Improvement Plans
Evaluation Report and Improvement
Analyzing Issues During Task Usage Observation
Deriving Satisfaction Scores and Significant User Feedback
Proposing Additional Improvement Suggestions Based on Improvement Requirements"
Usability Evaluation Planning
Designing the evaluation tasks:
: Identifying key tasks and deriving
qualitative/quantitative evaluation criteria
Defining evaluation participants and evaluation environment
Creating the evaluation plan document

Planning the evaluation

Setting Success Metrics
Creating success metrics
: 1. Defining a set of Key Performance Indicators (KPIs)
to measure the success of UX
2. If a task fails to reach the defined success metric values,
it is marked as a failure, and then undergoes UX improvements
Example) Detailed KPIs for Each Task
Success


Task 1 : Connect the scooter and the app via Bluetooth
> Completion Time: Within 10 seconds (average of 10 individuals)
> Usability Score: 4.5 or higher (average of 10 individuals)
> Button Clicks: 3 or fewer (average of 10 individuals)
> Information Provision: 4.0 or higher (average of 10 individuals)
> Design (GUI) Intuitiveness: 4.5 or higher (average of 10 individuals)
Challenges and key feedback elements
experienced by users during task execution
Analysis framework for results
The analysis of results was conducted from two perspectives: one centered around qualitative data obtained through interviews,
and the other centered around quantitative data obtained from testing, resulting in a comprehensive assessment
Task execution results (Example: LED color change)
We analyzed evaluators' scorecards for each task based on detailed key performance indicators (KPIs) and measured the success/failure of each task.


Change the color of the LED.

Lee, Yong
33, Teacher, Seoul, Korea
"I feel that the speed of transmitting and changing
colors on the scooter is slow. It needs to be faster."
low
high
Test Result
Task execution time
Usability score
low
low
high
1
high
2
Button click count
3
Information provision
4
Design score
5
7 seconds
2 Times
1
1
2
2
3
3
4
4
5
5

Kim, Ji-Young
27, Photographer, Seoul, Korea
"It's great that I can check the LED colors
in the app and apply them directly to the scooter."
Information provision
low
high
Test Result
Task execution time.
Usability score
low
low
high
1
high
2
Button click count
3
4
Design score
5
10 seconds
4 Times
1
1
2
2
3
3
4
4
5
5

Choi, Seung-Ho
36, Graphic Designer, Seoul, Korea
"I'd like to record my own color history that I've applied,
so I can choose and use it again later."
low
high
Test Result
Task execution time
Usability score
low
low
high
1
high
2
Button click count
3
Information provision
4
Design score
5
13 seconds
3 Times
1
1
2
2
3
3
4
4
5
5
Various data such as usability score, button click count, information provision/design score, etc.
Connectivity with
the mobile app
Setting LED colors
Cruise mode
Night visibility
AUI
Dashboard information
Lock mode
App information
Common issues identified redundantly in both quantitative and qualitative data
Quantitative data
Data
A
Average
8 seconds
4.4 points
3.4 times
4.2 points
4.1 points
Failure
Success
Success
Success
Success
정량 데이터
Data
A
Duplicate issues
Data
B
Qualitative data
Data
C
정성 데이터
Data
C

Analysis Framework
Through interviews, we analyzed the issues and feedback users encountered during tasks using affinity diagrams. We then compared this with quantitative data, identifying recurring problems and making improvements.


Displaying a list of nearby
devices available for BT connection

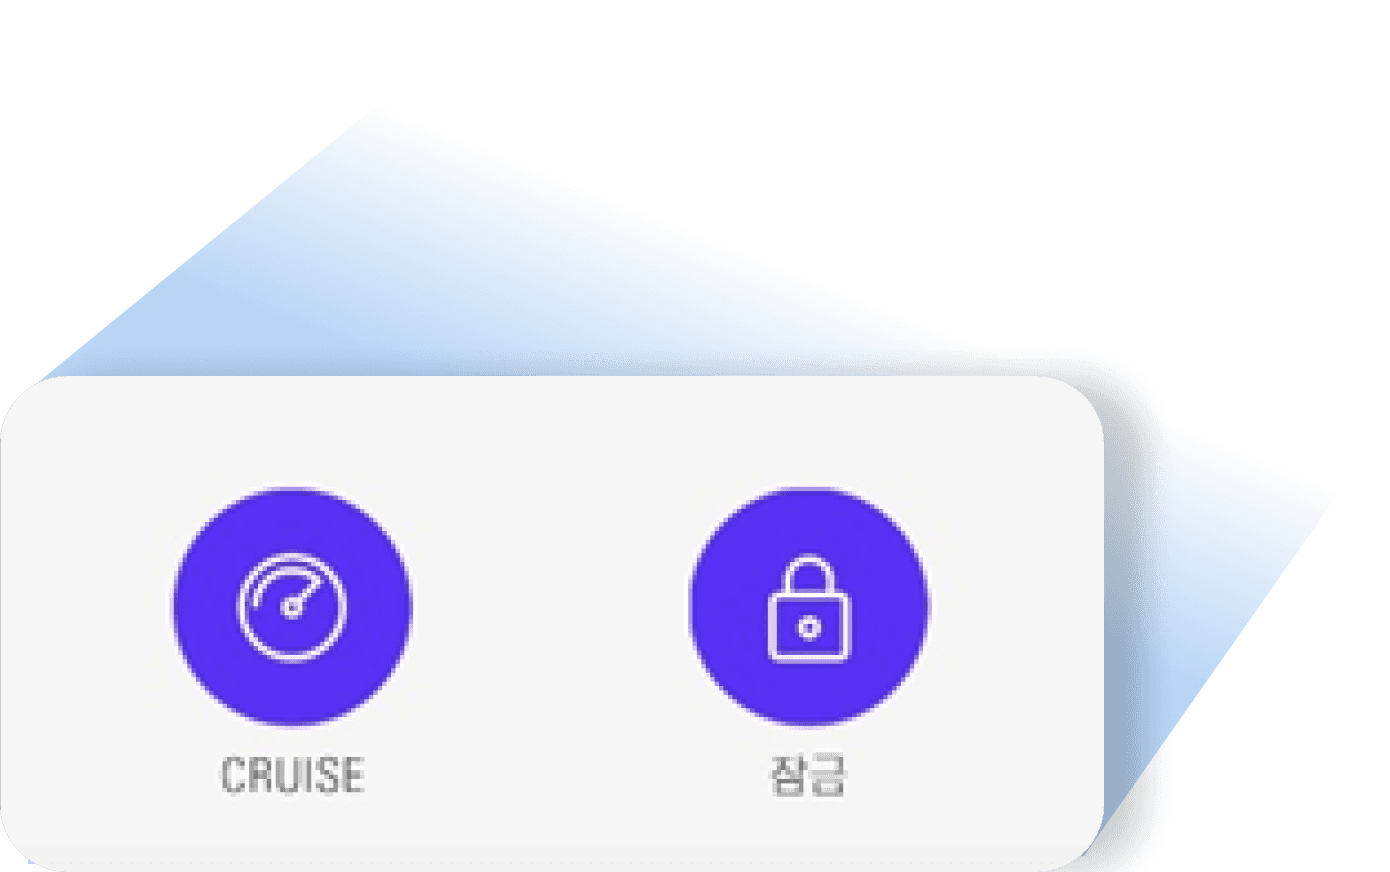
Providing a control area at the bottom of the
main screen for Cruise Mode and Lock Mode On/Off
Key information during driving
Comprehensive information provision for navigation, including
speed, cardinal points (direction), accumulated distance, speed limits,
battery level, temperature, travel time, and total distance covered
Main Dashboard


Color change through Bluetooth connection
Searching for nearby BT-connectable devices
Entering LED setting

: Design for display panels showing information design
(Registration No: 3011002790000)
: Design for display panels showing information design
(Registration No: 3011002780000)


Efficiently gather information
while on the move during driving
Effortlessly catch crucial information on the main screen while driving
Easy connection
Quick Bluetooth connection before driving
Automatic priority connection if previous pairing
records exist


Intuitive setting
Cruise and lock settings with a single tap for easy On/Off
Directly transmit and apply the desired LED color values
to the scooter for immediate confirmation


Color System
Main Color Table
Point Color
#5732F4
Main
#FFFEFF
#F14C4C
#30A3E5
#080808
Icons
Main Icons


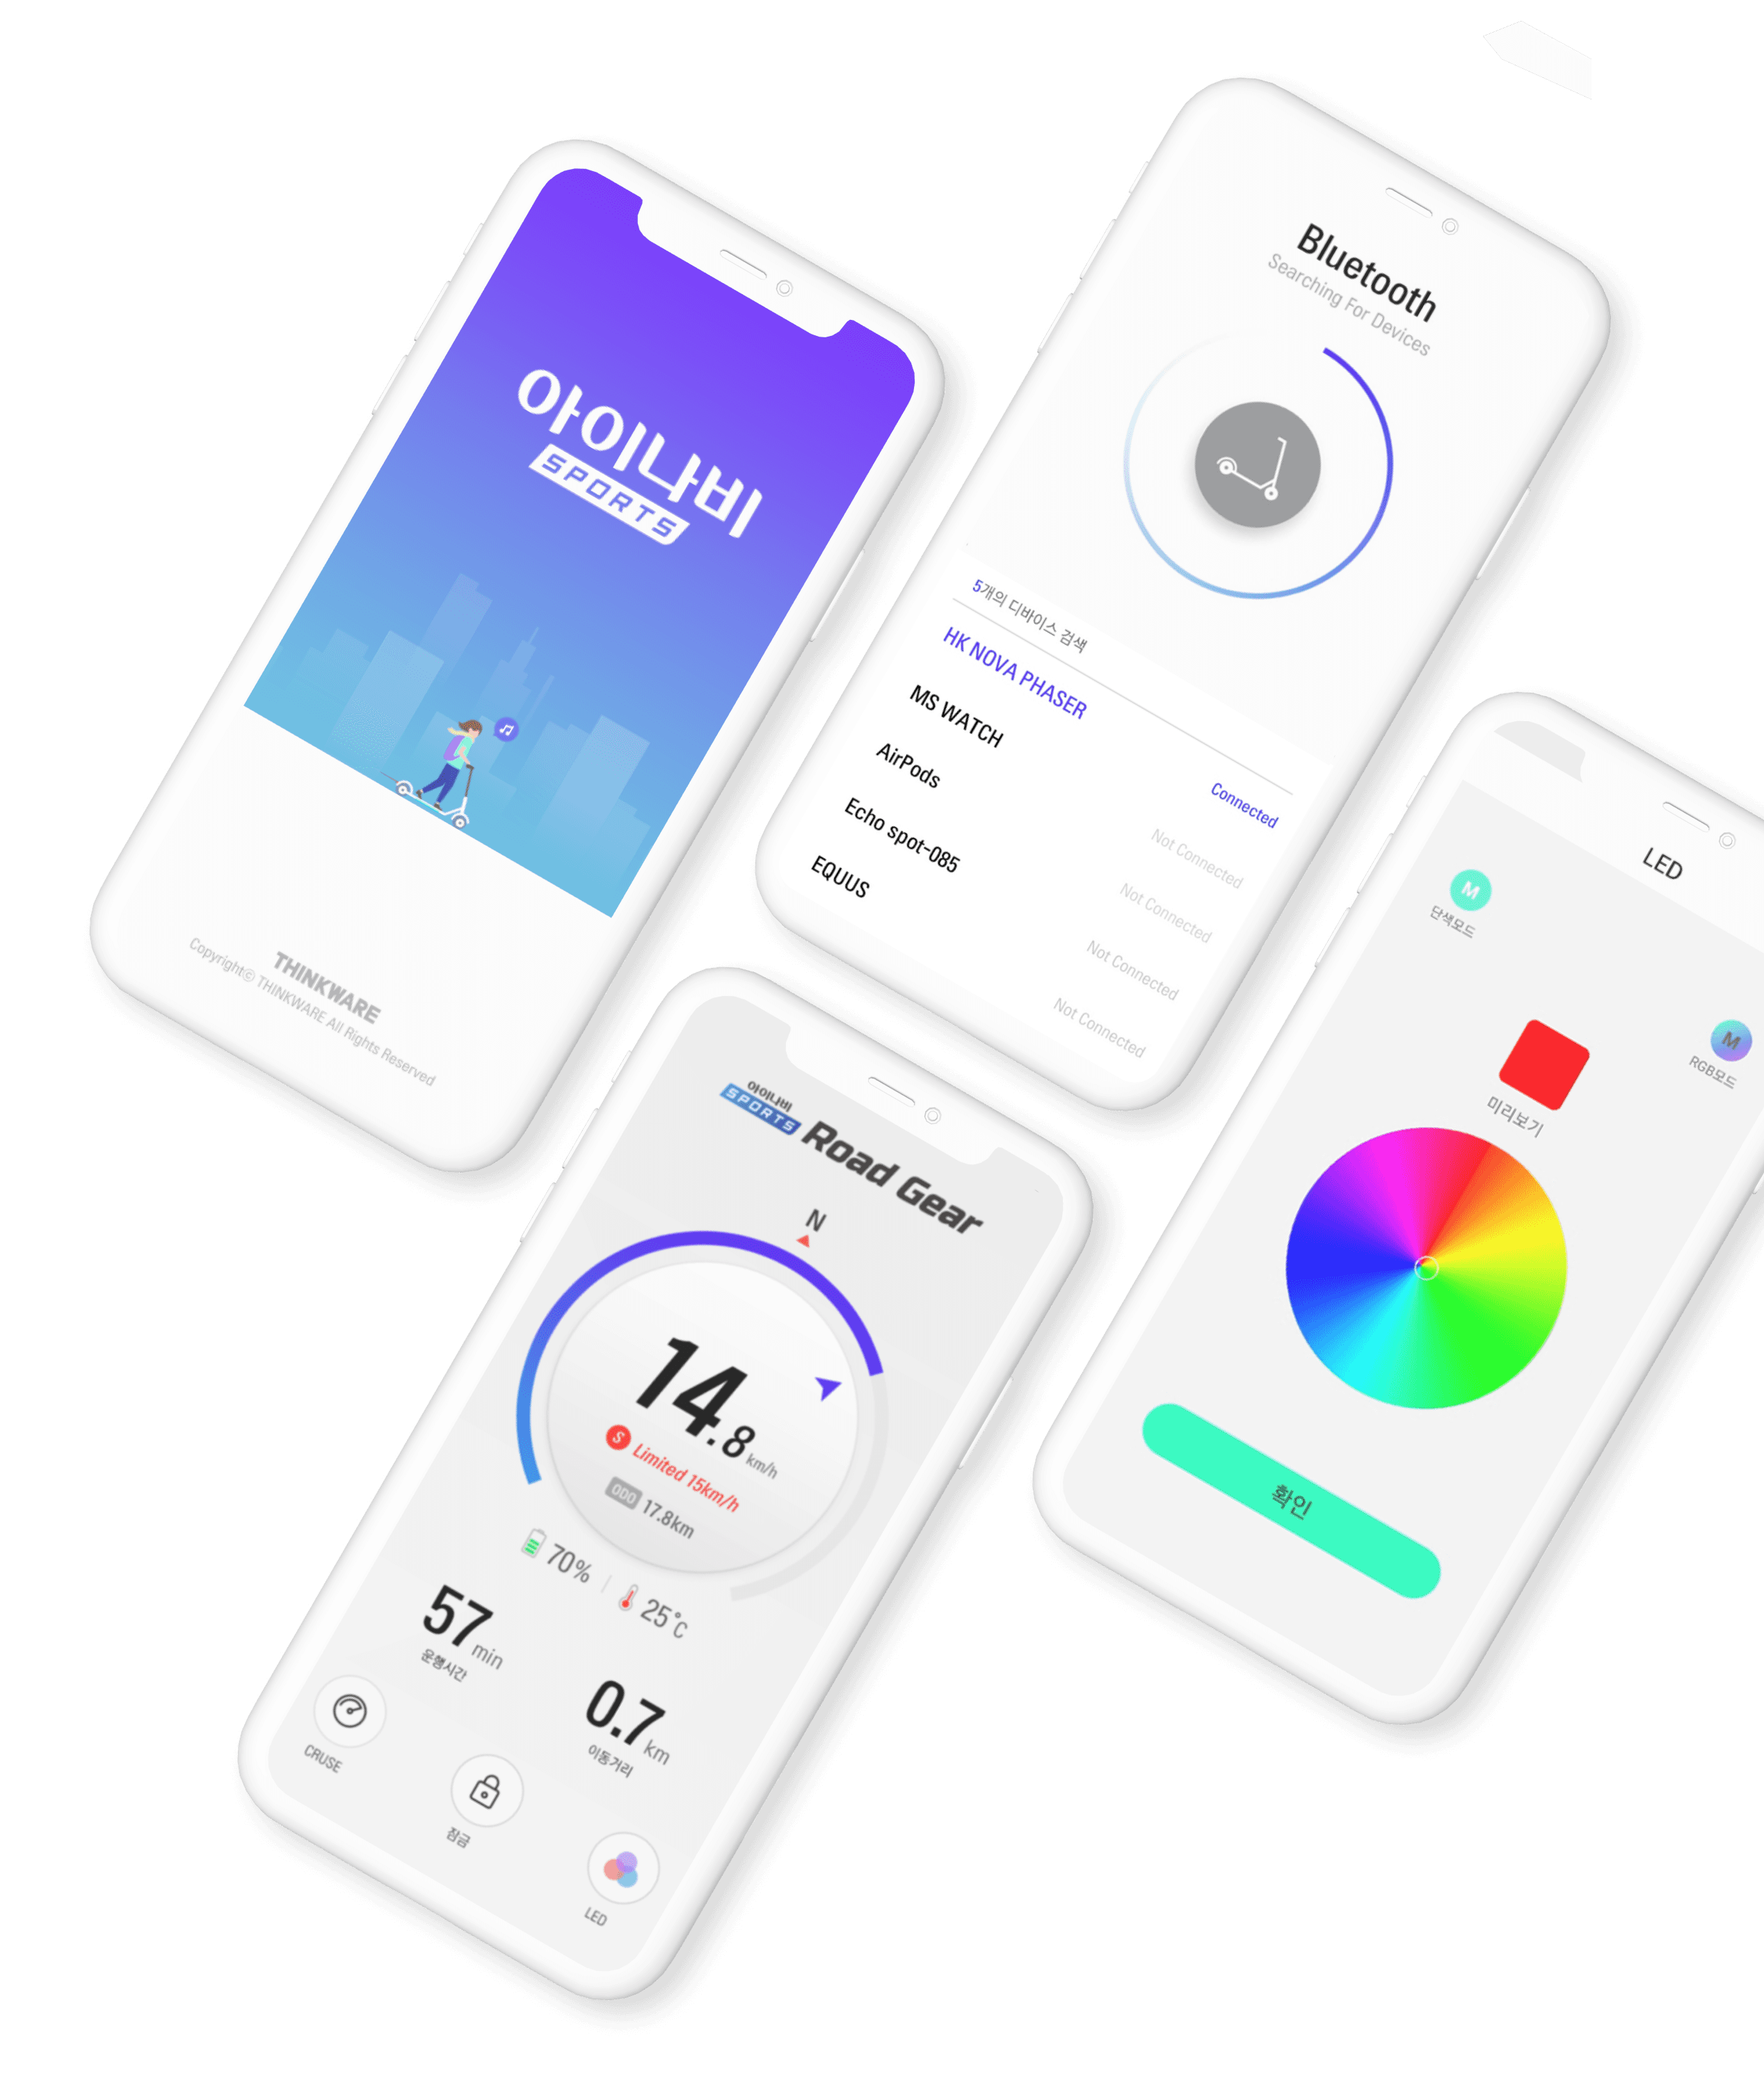
Final Design
Based on the usability evaluation results, we made additional improvements and proceeded with the design work, focusing on the finalized key screens.
We proposed a design for the key screens with a simple and clean color scheme, ensuring that essential information is presented clearly at a glance.
Copyright © 2025 Min Suk Kang. All rights reserved.